


Boston Transportation Department Traffic Analysis
BTD’s December 6, 2012 presentation includes some important information related to traffic and how they will be handled under the Surface Option and the Underpass Option at Austin Street. We copied a few of the pages of the presentation and explain their significance below. These slides are labeled as "2012" in parentheses.
BTD took traffic counts throughout the project area in 2008 before the economic downturn and before several major construction projects began. In response to community comments, they took additional counts in 2011 in the Austin Street underpass. What they found was that the numbers did not change much over the three years.
Traffic counts were taken again in 2015 and found some increases in traffic, which is not surprising given how the area has rebounded since the Great Recession in 2007-08. However, the change was not dramatic overall and traffic remains below what the roadway has capacity for. Slides from BTD's June 30, 2016 presentation and May 18, 2017 can be found below the 2012 slides. All slides are labeled as "2012", "2016", or "2017" in parentheses.
Throughout this page and BTD's presentations, it is important to remember that 1 lane can typically accommodate 1,000 vehicles per hour.
Traffic Volumes During the Morning Rush Hour (2012)

Blue numbers are car counts at the surface and red numbers are car counts in the underpass.
The number of cars turning off of Rutherford Ave inbound onto the Gilmore Bridge (829 vehicles) and the number of cars heading toward downtown (1,515 + 70 vehicles) are significantly higher than any other traffic movement. However, in a later slide (page 13), BTD notes that a single traffic lane can accommodate 1,000 vehicles per hour. This means that even though the number of cars heading toward downtown seems high, it represents less than 2 lanes worth of traffic.
The number of cars turning off of Rutherford Ave inbound onto the Gilmore Bridge (829 vehicles) and the number of cars heading toward downtown (1,515 + 70 vehicles) are significantly higher than any other traffic movement. However, in a later slide (page 13), BTD notes that a single traffic lane can accommodate 1,000 vehicles per hour. This means that even though the number of cars heading toward downtown seems high, it represents less than 2 lanes worth of traffic.
Traffic Volumes During the Evening Rush Hour (2012)
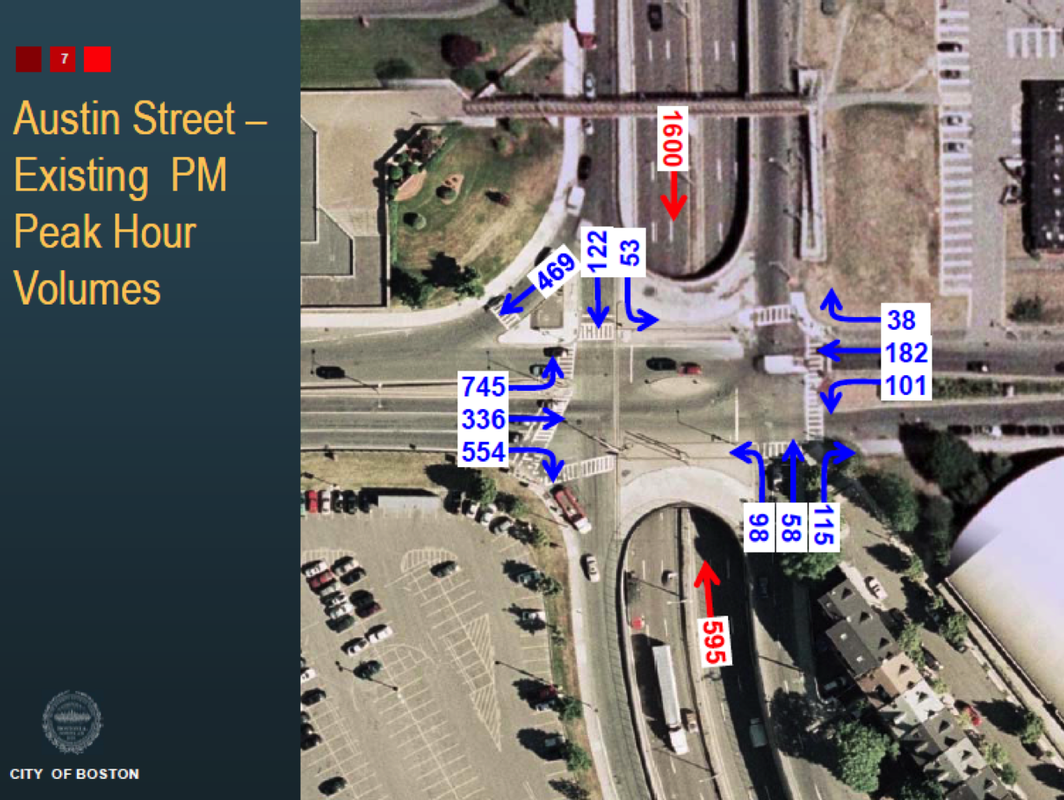
There is a strong demand coming from the Gilmore Bridge and turning left onto Rutherford Ave toward Sullivan Square (745 vehicles) or right on Rutherford Ave toward downtown or the Tobin Bridge (554 vehicles). Interestingly, there are actually more cars inbound toward downtown in the afternoon than in the morning. Since one lane can accommodate 1,000 vehicles per hour, the inbound traffic heading into the intersection (1,600+122 vehicles) only requires 2 lanes. Below the intersection, it may be important to keep a separate lane for the Tobin Bridge traffic. This can be looked at in the next phase of design.
Traffic Volumes Applied to the Underpass Option (2012)
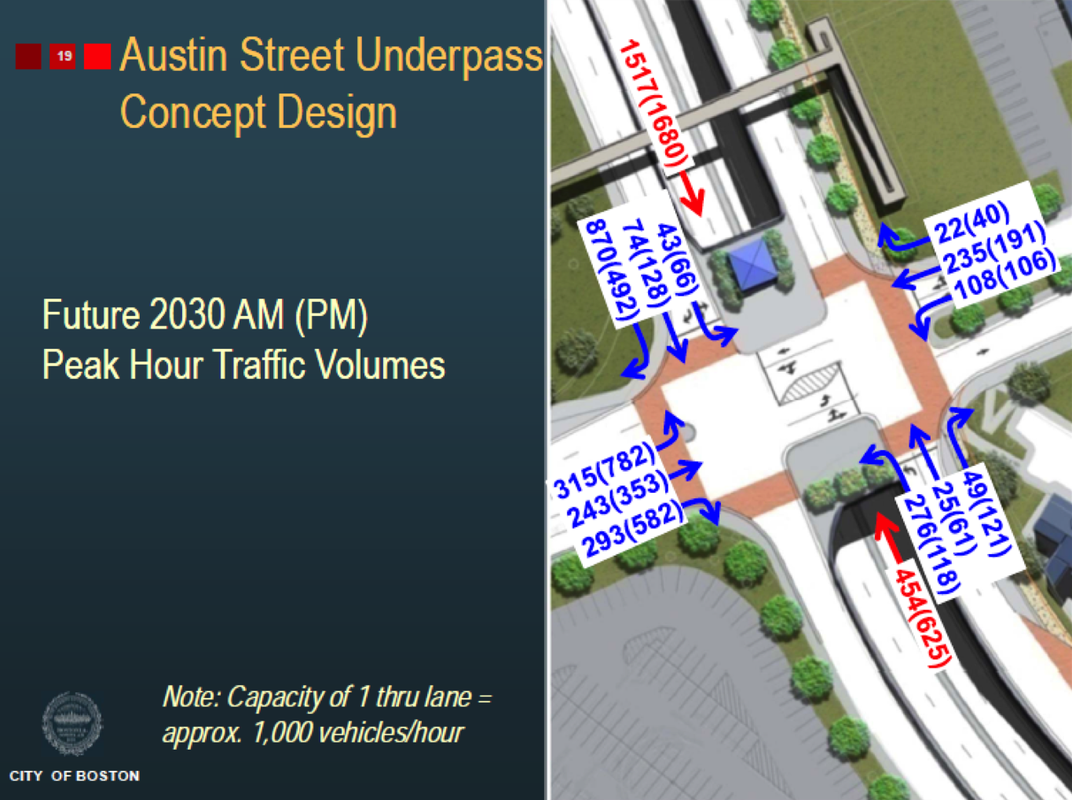
Here BTD models traffic volumes in the Underpass Option using the morning and afternoon commute numbers, with afternoon numbers in parentheses. Note that there is one arrow per travel direction, regardless of the number of lanes planned. For example, coming off of the Gilmore Bridge, there will be 2 lanes turning left, but only one blue arrow is shown.
A few points of interest:
- The 353 vehicles traveling from the Gilmore Bridge directly into Charlestown in the afternoon will need to use the same lane as people turning left onto Rutherford Ave (up to 782 vehicles).
- The 43 vehicles turning left into the neighborhood from Rutherford Ave inbound in the morning will be in the same lane as the 74 people going straight. These may be impacted by vehicles turning right onto the Gilmore Bridge in the morning. [Question remains whether the 90 degree right turn shown next to the Community College can really accommodate the 870 vehicles turning during the morning commute (see where it says “870(492)”.)]
- Traffic demand outbound requires less than 1 lane (454 vehicles in the morning when one lane can handle 1,000 vehicles) but BTD needs to build 2 lanes in case there is an accident or breakdown in the underpass.
- BTD does not address what will happen in the middle of the intersection – a place where vehicles back up right now. BTD presents this as a simple 4-way intersection, but it is actually 2 signal lights that are supposed to work together. Consider what happens when someone goes through a yellow light and gets stuck in the middle.
Traffic Volumes Applied to the Surface Option (2012)
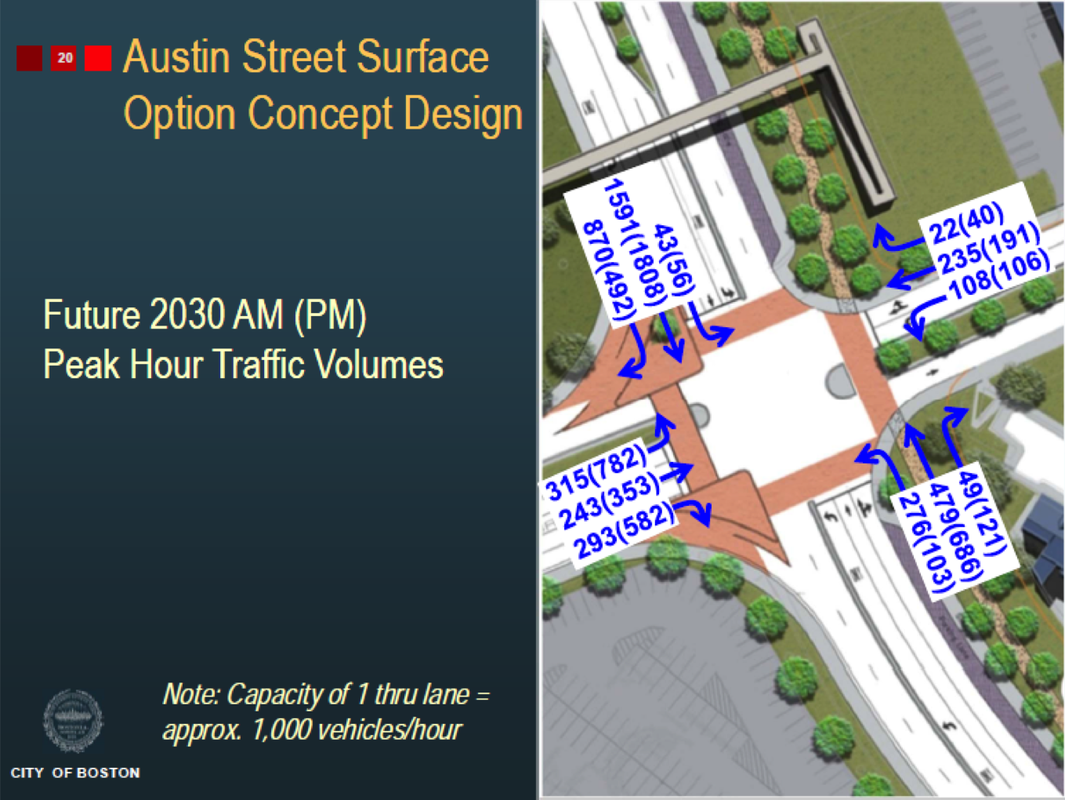
Here BTD models traffic volumes in the Surface Option using the morning and afternoon commute numbers, with the afternoon numbers in parentheses. Note that there is one arrow per travel direction, regardless of the number of lanes planned. For example, coming off of the Gilmore Bridge, there will be 2 lanes turning left, but only one blue arrow is shown. Also, there are two right lanes onto Gilmore Bridge and only one blue arrow is shown.
A few points of interest:
- The 353 vehicles traveling from the Gilmore Bridge directly into Charlestown in the afternoon will have their own lane.
- Two surface lanes are sufficient to accommodate inbound traffic in the morning (1,591 vehicles) and the afternoon (1,808 vehicles) since they will be able to handle 2,000 vehicles per hour combined.
- A “free” right separates traffic heading onto the Gilmore Bridge from the traffic heading straight through the intersection inbound.
- There is no space for vehicles to block the middle of the intersection. They will need to clear the center after each light change.
How Modern Traffic Signals Work

All signals will be activated by demand (bullet 1). This means that if there are no vehicles trying to exit the side streets like Essex or Baldwin Streets, the lights on Rutherford Ave will not automatically turn red. Vehicles in the night or early morning hours will likely have a uninterrupted flow through the area.
- The BTD Management Center will be able to observe if any traffic congestion occurs (bullet 2) and will be able to change the light timing remotely (bullet 4). The lights will be timed to allow vehicles to flow smoothly on Rutherford Ave, i.e., vehicles going the correct speed limit will be able to flow through a series of green lights (bullet 3).
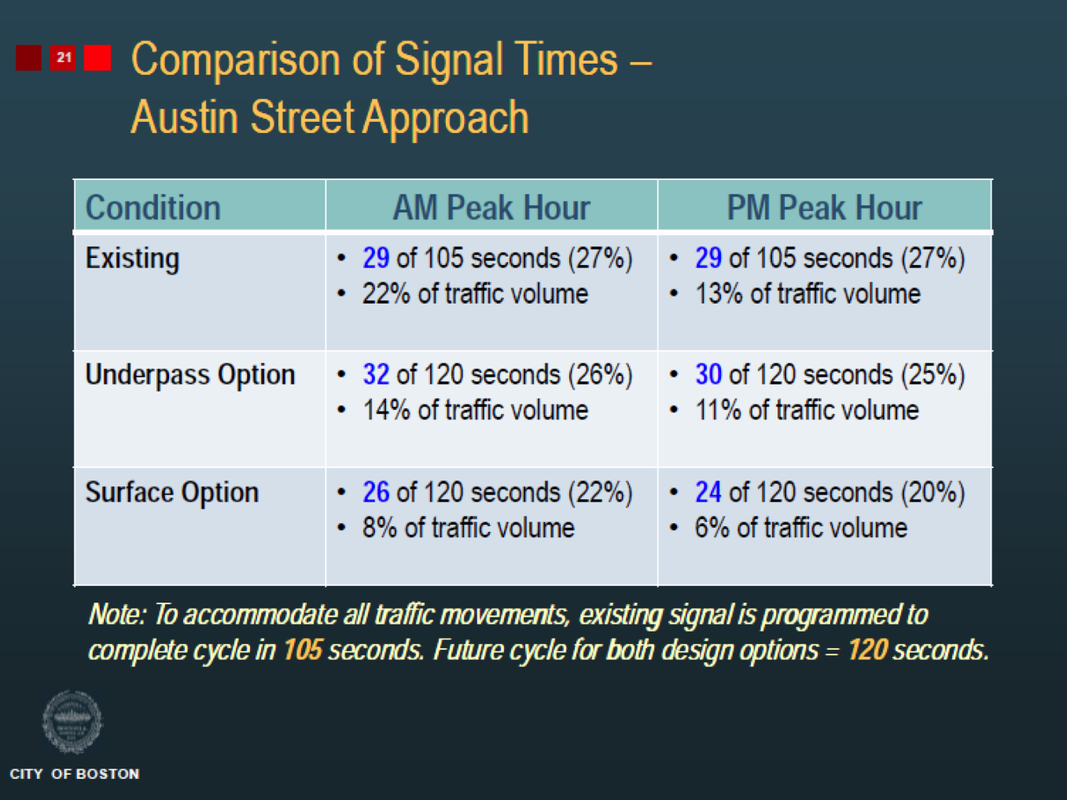
Here BTD compares how much time will be given to vehicles exiting Austin Street within each sequence of lights. Under both options, the light timing will be changed to a 2 minute sequence (120 seconds). Austin Street will be given 24-26 seconds under the Surface Option and 30-32 seconds under the Underpass Option – a difference of only 6 seconds between the two options.
What the slide doesn’t say is that in 30 seconds of green, approximately 18 vehicles can move through the intersection per lane. This means that with the 24 seconds provided in the Surface Option (PM peak), 28-30 vehicles will be able to get through the light each time it turns green - assuming that the left turn lane and the right turn-through lane (i.e., 2 lanes total) get the green at the same time.
Given that only 365 vehicles leave Austin Street during the peak afternoon commute, it is unlikely there will ever be 28-30 vehicles cued up at any one time at that location…
Implications of Updated Traffic Counts (2016)
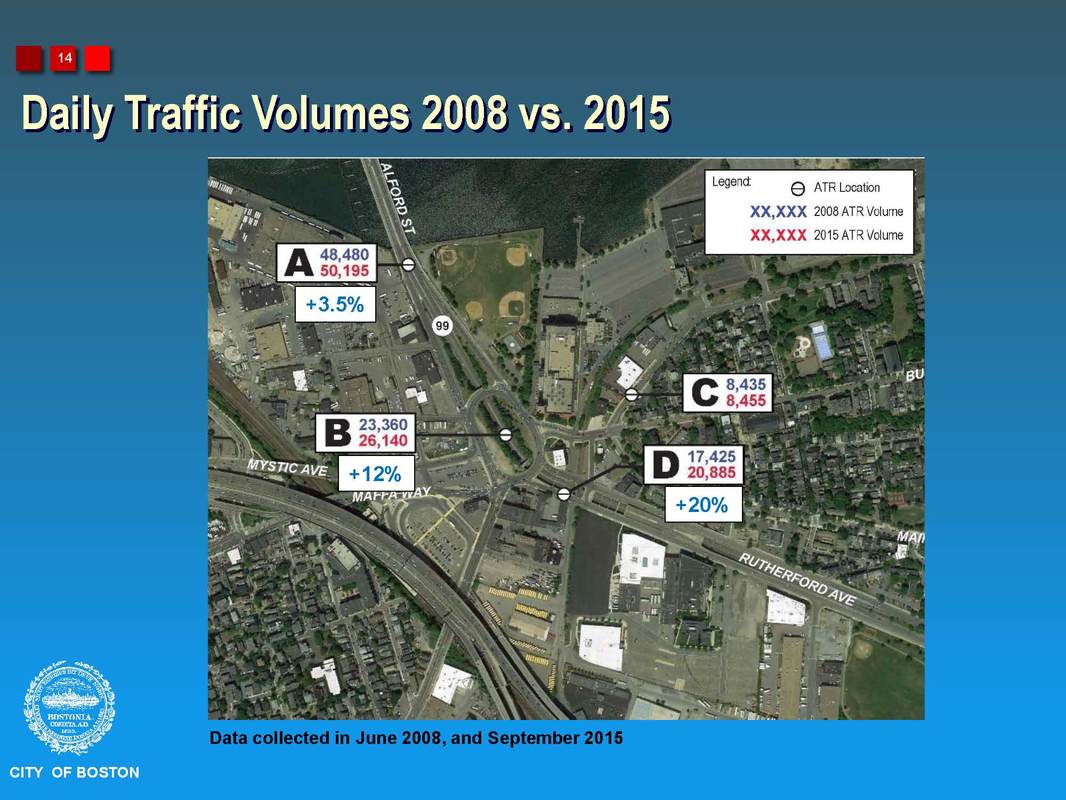
In this graphic, BTD shows that daily traffic volumes have increased over the past 7 years - a fact that is not surprising given that the Great Recession occurred during 2007-2008 when the prior counts were taken. However, what is most significant is how small the increase has been - 3.5% at the Alford Street Bridge (shown as "A") and literally 20 cars per day at Terminal Street (C). The 12% and 20% increases in the underpass are not surprising because one lane was closed in 2008 (B and D) and they are misleading since the volume at the Alford Street Bridge, which all the underpass vehicles have to pass, has only gone up by 3.5%. Further, the use of daily volumes by BTD is problematic as it does not paint a picture of the peak hours when drivers will feel the impact of traffic congestion. Across the U.S. peak commute hours are increasing in time - when looking at modest increases in total daily volumes this does not necessarily mean that the peaks have increased in intensity. Change at Austin Street was equally modest, with a 4.2% increase on Rutherford Avenue just south of Austin Street and a 3.5% decrease in the southbound turn onto Prison Point Bridge heading into Cambridge.
Growth in Orange Line boardings was much greater than the growth in daily traffic volumes. In fact, BTD reports that Sullivan Square Station boardings increased by 19% between 2008 and 2013 (2 years earlier than the traffic counts), from 8,495 per day to 10,125. The growth at Community College Station was even greater - 45% growth from 3,424 to 4,956 riders per day.
Growth in Orange Line boardings was much greater than the growth in daily traffic volumes. In fact, BTD reports that Sullivan Square Station boardings increased by 19% between 2008 and 2013 (2 years earlier than the traffic counts), from 8,495 per day to 10,125. The growth at Community College Station was even greater - 45% growth from 3,424 to 4,956 riders per day.
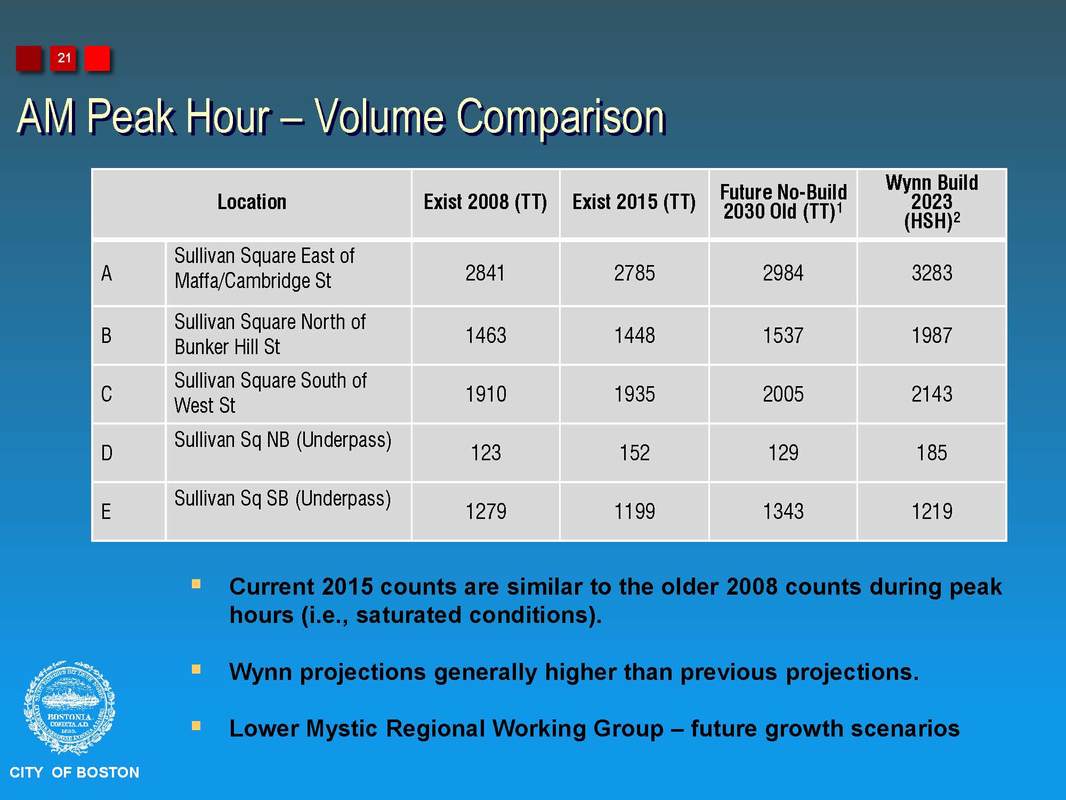
Here, BTD provides information on the travel volumes during the morning commute. As can be seen, there is nearly no change between 2008 and 2015. They (fairly) indicate that that is because the roadways only have so much capacity to process vehicles and that they are saturated and cannot accommodate more. What is interesting are the Wynn Build figures - the graphic does not indicate who the additional 500 morning commuters are. If they are employees and it is a 24-hour operation, can traffic demand management be applied so that their shifts change during off-peak hours. If they are visitors why would they be traveling during work commute hours? Lastly, note the fact that the underpass use basically only represents one travel lane at 1,000 vehicles per hour.
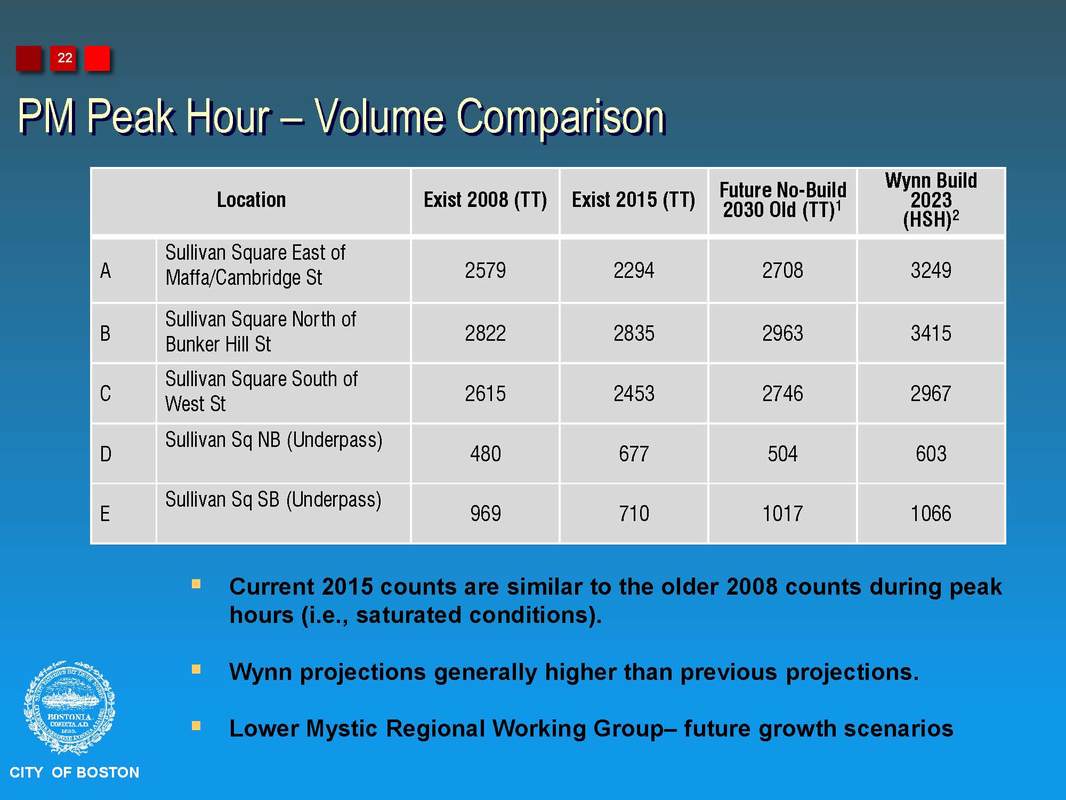
Wynn's figures are more significant in the afternoon peak with 1,000 additional cars at Maffa Way/Cambridge Street and approximately 600 north of Bunker Hill Street. BTD's note about Wynn's projections being higher than previous is an interesting comment.
Delay Difference between Underpass and Surface Options (2017)
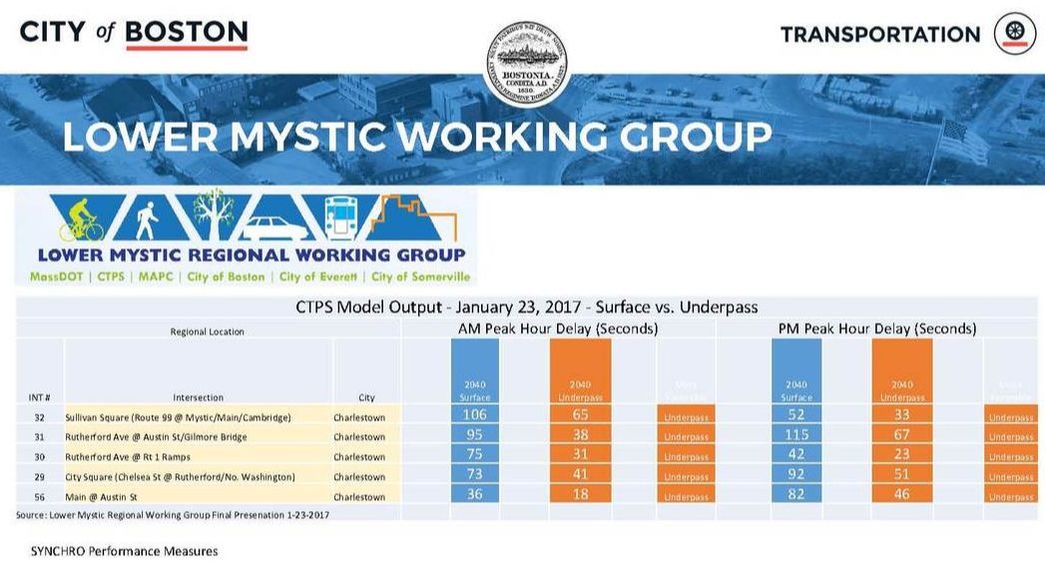
Perhaps the best way that drivers can perceive the difference between the Underpass and Surface Options is to see how they will affect their ability to move throughout the area. The graphic above indicates that the travel time across the study area (i.e., from Sullivan Square to the North Washington Street Bridge) will be only 3.2 minutes longer with the Surface Option in the morning and 2.7 minutes in the afternoon during peak hours and in the year 2040. Given the margin of error potential in these studies and the fact that the figures are 23 years in the future, those delays are truly non-existent.
Peak Hour Levels of Service (2017)
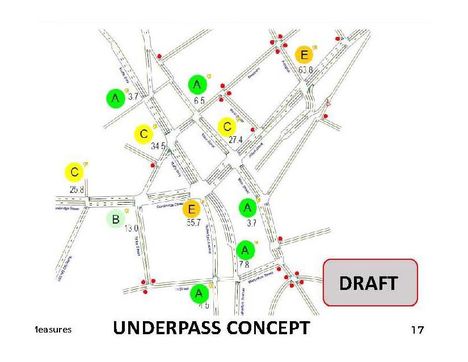
In May 2017, BTD provided information on the peak level of service (LOS) for both options. The image at the right shows the morning commute, which is the most congested travel time in the area. As can be seen, the majority of the area has LOS of A. That is actually not appropriate in an urban area. The definition of LOS A for a roadway is "Free flow. Traffic flows at or above the posted speed limit and motorists have complete mobility between lanes. The average spacing between vehicles is about 550 ft(167 m) or 27 car lengths...LOS A generally occurs late at night in urban areas and frequently in rural areas." At an intersection, the wait time under LOS A is less than or equal to 10 seconds, even taking into account left turns and pedestrian crossings. (wikepedia) If this LOS is available during the most congested times of day, then throughout the rest of the day it will be highly over capacity and vehicles will be speeding.
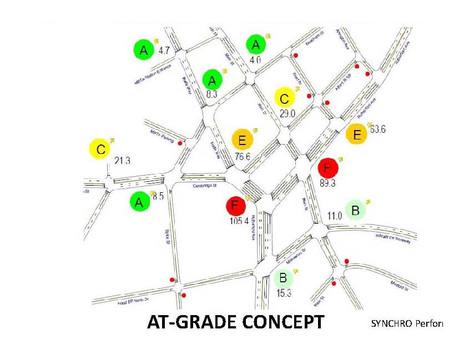
This is the projected LOS for the Surface Option, in the version shown in May 2017. In this version. BTD did not make attempts to distribute traffic throughout the area and instead added multiple lanes to Rutherford Ave and Main Street/Maffa Way. It needs to be and can be improved upon. Even so, transportation professionals are differentiating between “big LOS F” and “small LOS F” and finding that a small LOS F can be acceptable. Further, transportation professionals have stated that LOS E is actually the most efficient use of roadway space.
